Monitoring the performance and behavior of a cloud server is essential to ensure the efficient operation of hosted applications. One of the main utilities for this task is HTOP, an interactive tool that displays in detail the use of system resources, such as CPU, memory, and active processes. HTOP offers an intuitive visual interface, making it easy to identify bottlenecks and manage processes in real time.
It is very important to highlight that although Peqi provides CDN and WAF services to improve the performance and security of applications, the analysis and monitoring of server resources must be carried out directly on your hosting. This is because Peqi operates at the content distribution and security layer, while HTOP analyzes the resources and processes of the server where the application is hosted.
Understanding HTOP
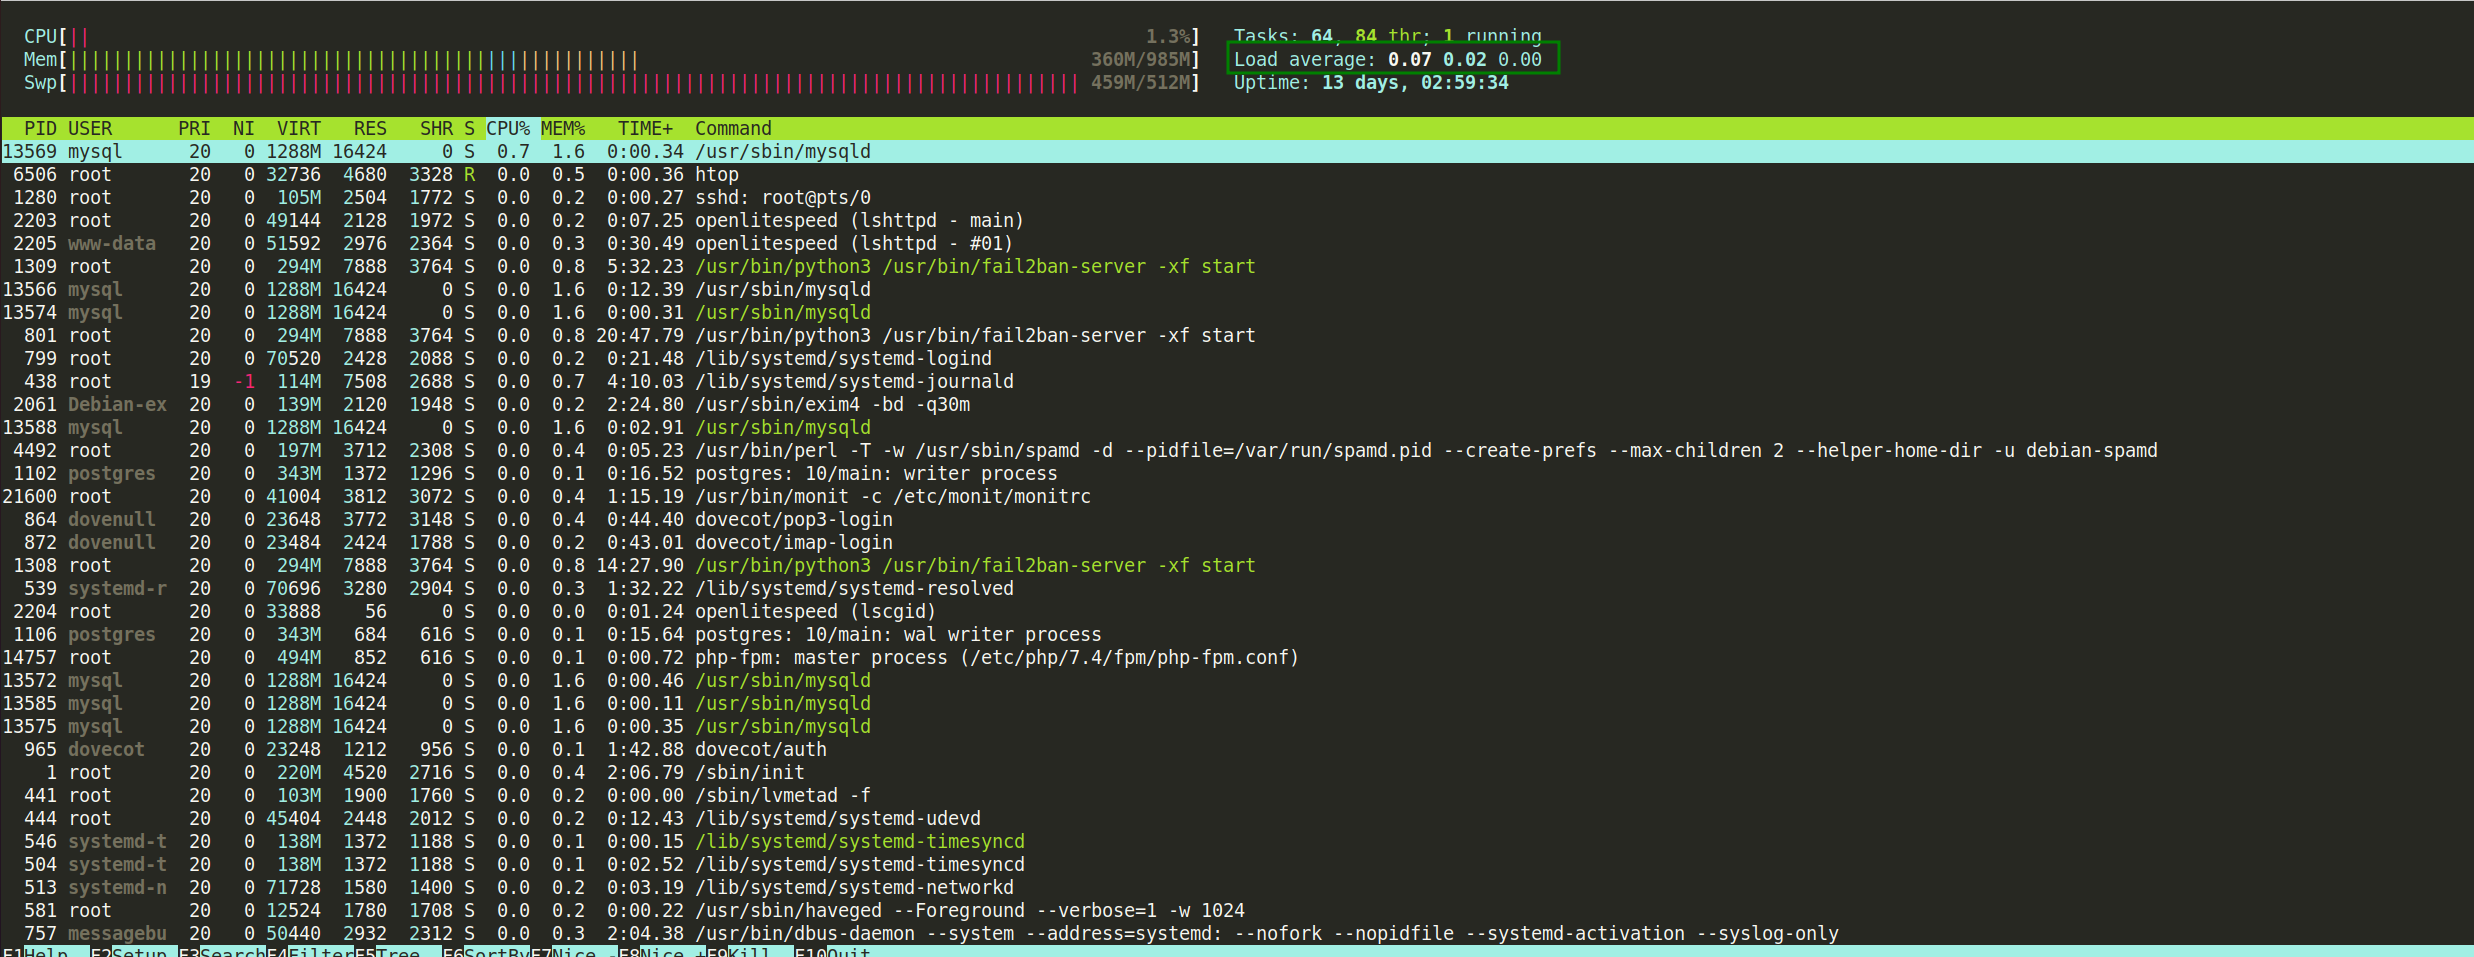
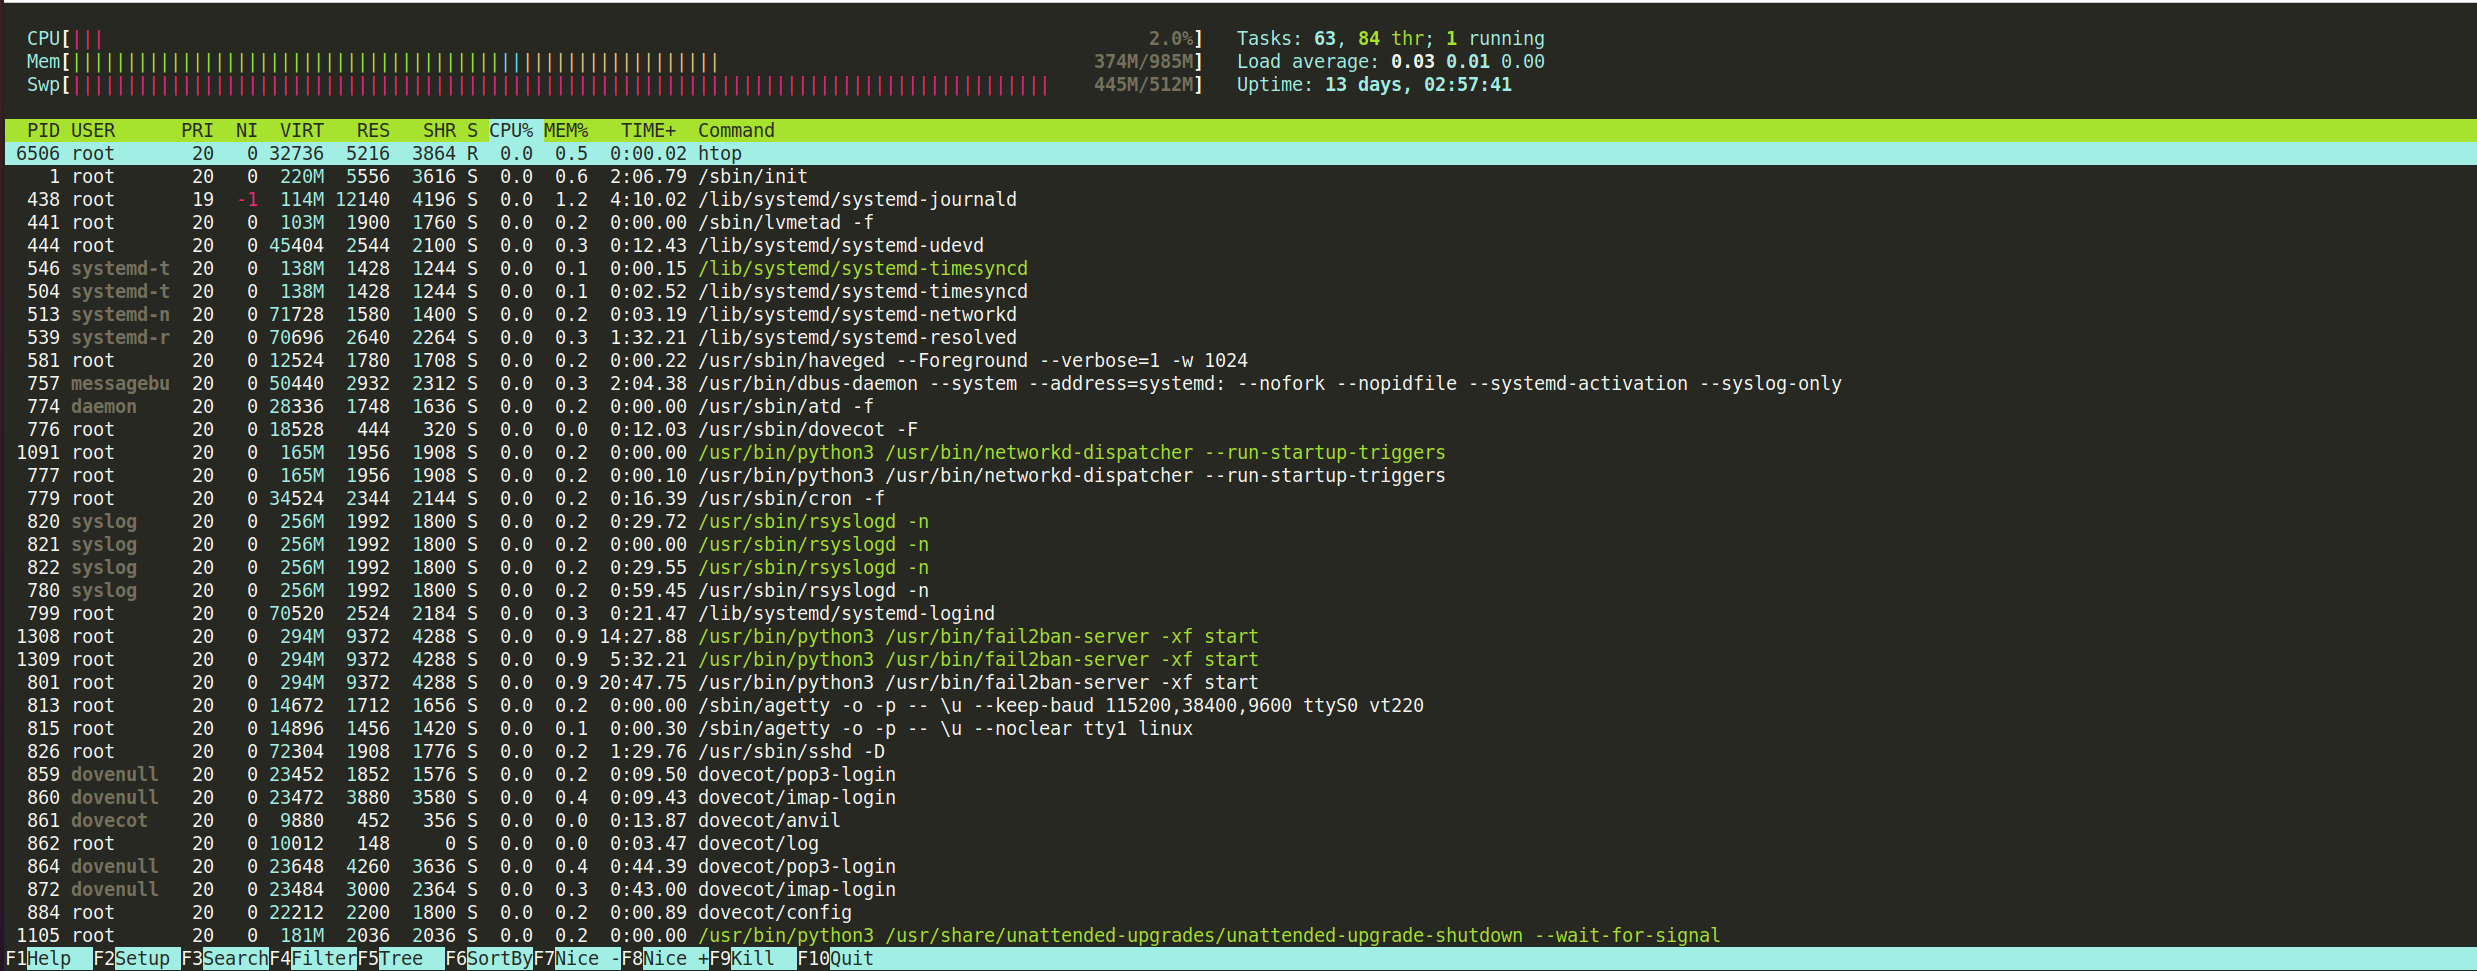
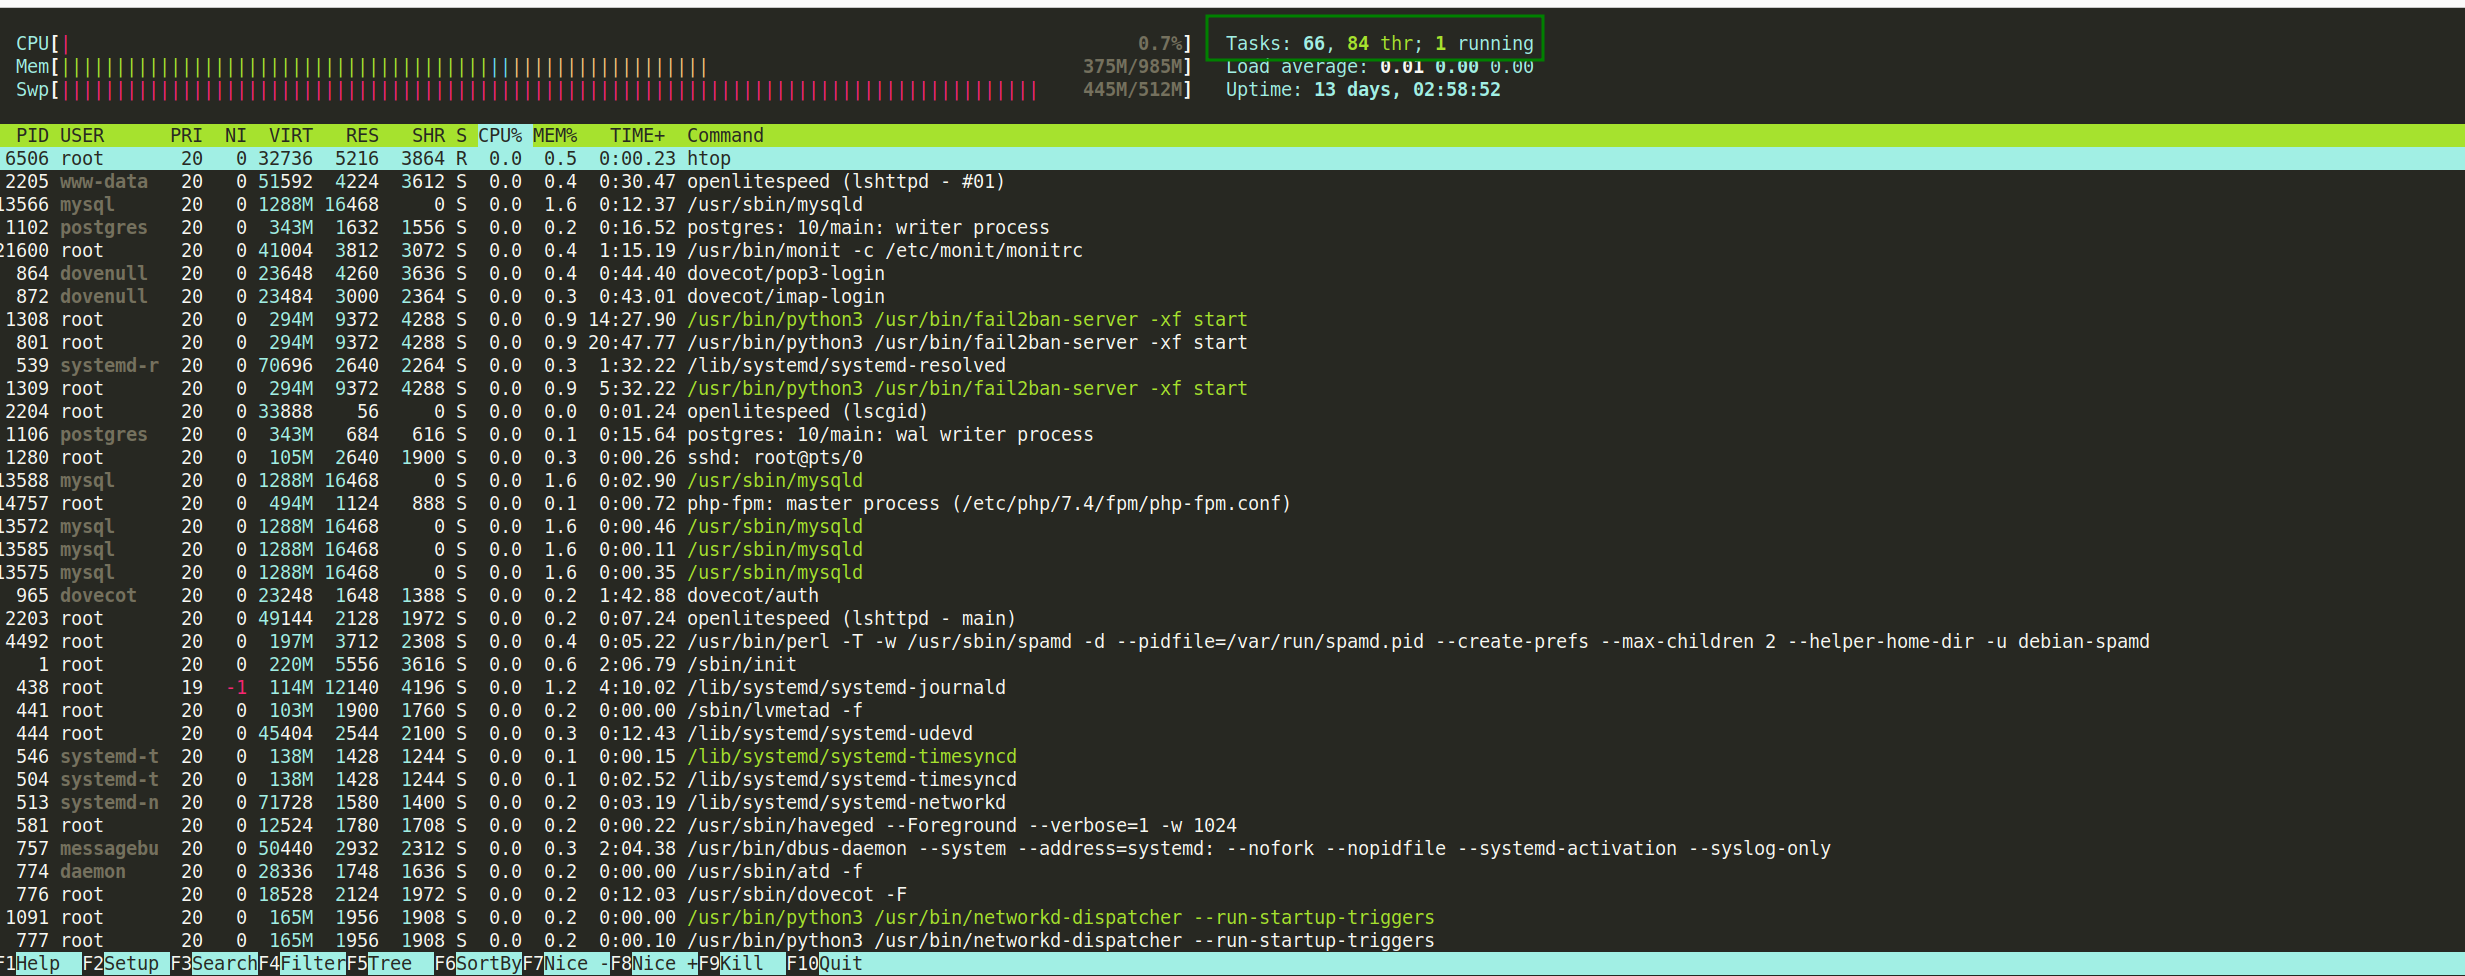
When accessing your hosting via SSH and typing HTOP, you will see the following:
On the left side, CPU usage is represented by percentages using different color bars for different types of processes.
Blue: Processes with low priority or nice > 0.
Green: Normal user processes.
Red: Kernel processes
Gray: I/O wait time
NOTE: In the example above, we have 1 core on the machine. If it were a machine with 4 cores, htop would number the CPUs from 1 to 4.
Still speaking of colors, memory usage is present below the CPU usage bars, displaying the amount of memory consumed by processes.
Green: RAM consumption by memory pages
Blue: RAM consumption by buffer pages
Orange: RAM consumption by cache pages
Tasks: Shows the number of open processes present in the system. Here, it displays 3 values that include the total number of tasks (66), the number of threads (84 thr), and the number of tasks currently running (1 running).
Load average: Load Average is the average number of processes that are in a running or uninterrupted state, thus dealing with the total average of that number of processes waiting in the run queue plus the number of processes currently running in the 1, 5, and 15 minute periods.

For example, if you see this number very high, it indicates some kind of problem, and you should investigate which processes are consuming the most.
Main keyboard shortcuts:
F2 - Enter htop setup;
F5 - Displays processes in a tree structure;
F6 - Selects a column for sorting;
u - Filters processes by a specific user;
P - Sorts by processor;
M - Sorts by memory;
T - Sorts by runtime.
Finally, Peqi helps deliver cached pages. This means that pages already stored in the Peqi cache do not need to be fetched from the origin, reducing the load on the hosting server and helping to keep the site available and fast, even during traffic spikes.
If you are not familiar with using HTOP, it is recommended to contact your hosting support team. They will be able to provide the necessary assistance to monitor and manage your server effectively.


